
Price Action trading, also known as trading solely based on the analysis of price charts without the use of lagging indicators, offers traders a stripped-down approach with fewer distractions.
In this blog post, we will dive into the key aspects of developing a proper price action strategy that can generate effective price action signals.
Generating price action signals
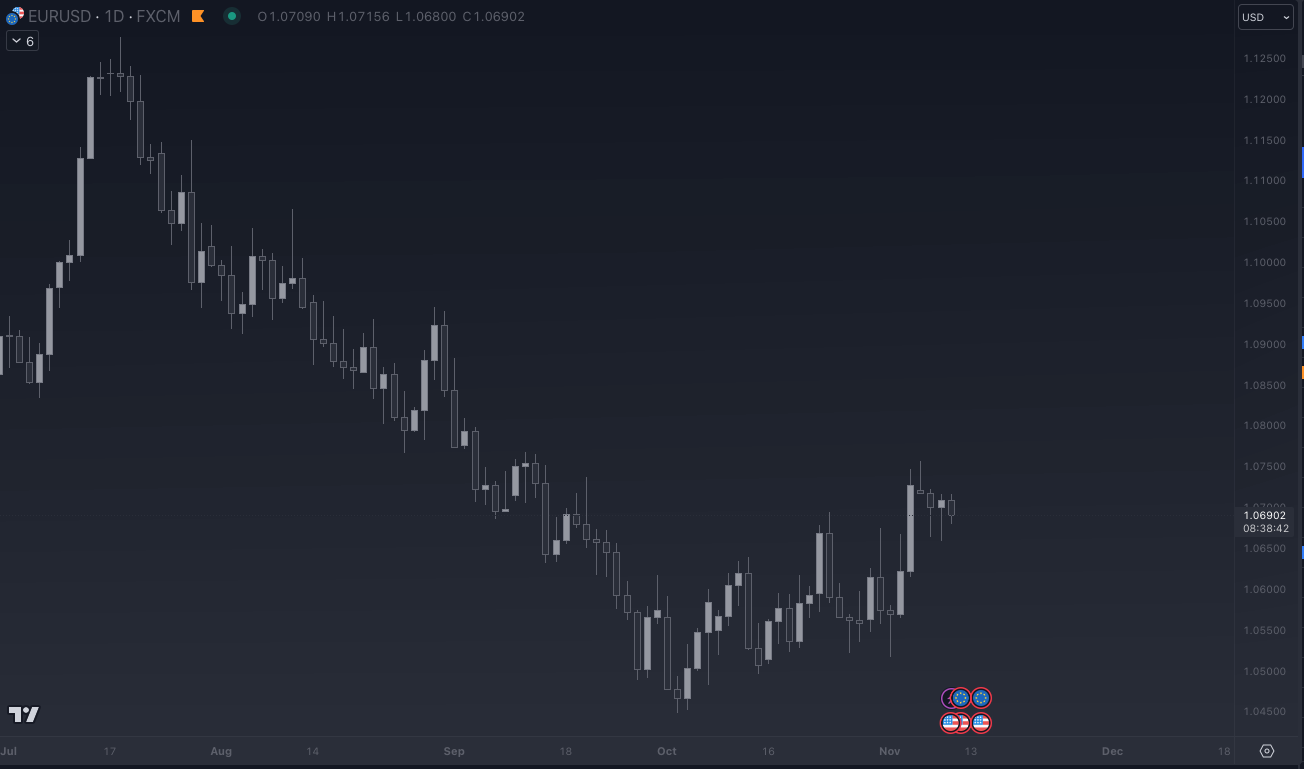
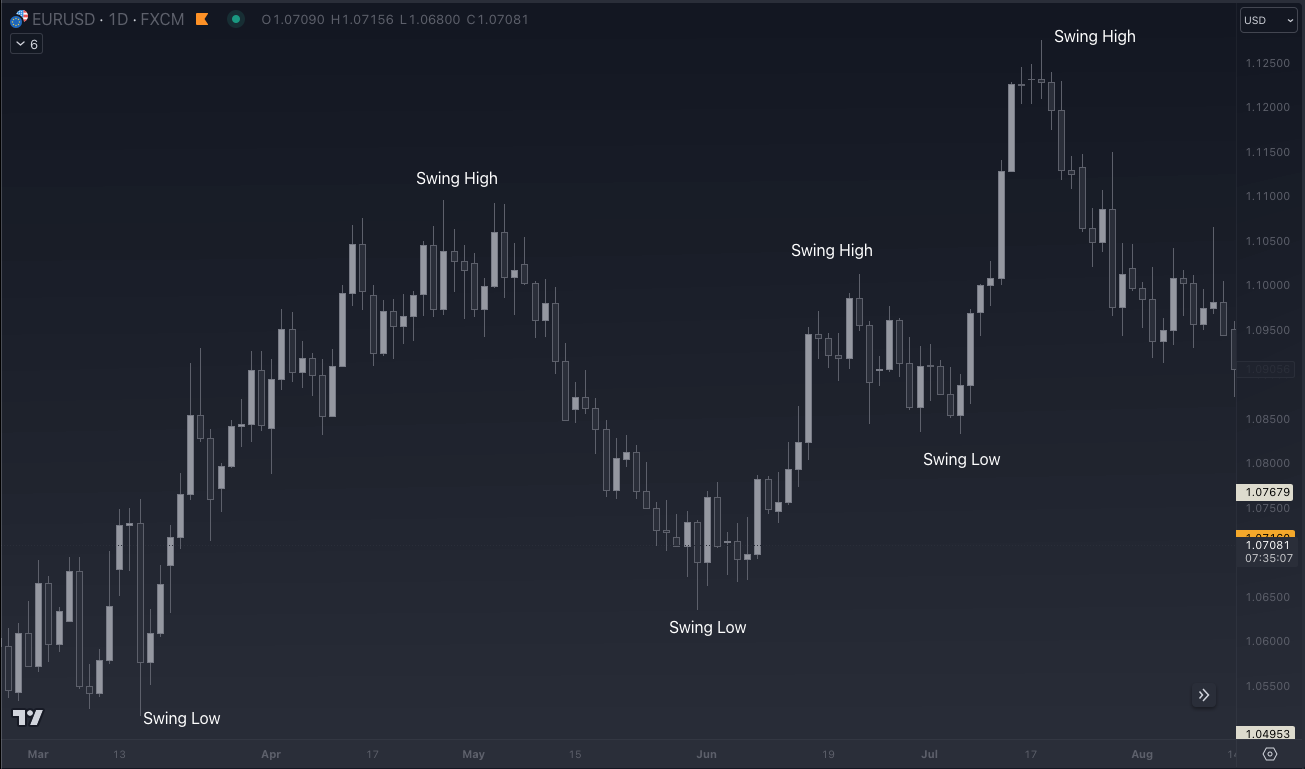
The chart example above shows a clean price action chart, with no mess, and no indicators, just pure price bars (D1 chart).
When it comes to generating price action signals, simplicity is key. By utilizing a clean price action chart free from cluttered indicators, traders gain valuable insights into the location of buy and sell orders.
This approach allows for a deeper understanding of market dynamics, as well as potential trading opportunities.
By examining the upper and lower wicks of candlesticks, we can identify the presence of buyers and sellers. Candlestick patterns such as the engulfing pattern or hammer/shooting star can provide significant advantages in trading.
Analyzing a price action chart devoid of lagging indicators offers a significant advantage.
Unlike indicator charts, which often require allocating precious chart space for multiple indicators, a clean price action chart provides a clear and unobstructed view of price movement.
This undistracted view enables price action traders to focus solely on the market’s behavior, gaining insights that may be missed when relying on indicators alone.

In contrast to indicator charts cluttered with indicators like Moving Averages, Bollinger Bands and RSI, a clean price action chart offers a distinct advantage.
Indicator charts often compel traders to sacrifice valuable screen area, as indicators are typically placed at the bottom or top of the chart.
Consequently, the essential part of the chart—price action—gets diminished and diverts attention away from its significance.
Moreover, indicators are derived from underlying price action, rendering them redundant in many cases.
Rather than providing unique insights or predictive clues, indicators merely introduce additional variables into the trading equation.
While certain traders may find success using indicators, a vast majority of traders find that a clean chart offers the most effective approach.
By focusing on price action alone, traders can develop a more comprehensive understanding of market dynamics.
Price action, with its raw and unfiltered data, reveals important information about supply and demand, key support and resistance levels, and market sentiment. This uncluttered approach provides traders with the necessary clarity to make well-informed trading decisions.
Ultimately, by opting for a clean price action chart over indicato traders gain a clearer perspective on market movements, allowing for better analysis and identification of potential trading opportunities.
Drawing support and resistance for price action patterns
Upon opening a new chart, it is crucial to identify and mark key support and resistance levels.
These levels represent areas where buyers and sellers previously encountered challenges, adding an extra layer of confluence when price action patterns emerge.
Support and resistance levels provide valuable reference points for executing effective trading strategies.
Waiting for the price action to execute your strategy
After identifying critical areas and establishing support and resistance levels, we enter a waiting game.
There are three classic and easily identifiable price action patterns:
– Hammer and shooting start candle (also known as pin bar signals a potential reversal))
– Bullish or bearish engulfing (for momentum and potential reversals)
– Inside day (mostly used by breakout traders during a trend)
By spotting these patterns, traders can identify potential reversals, momentum shifts, and breakout opportunities.
Hammer & Shooting star price action
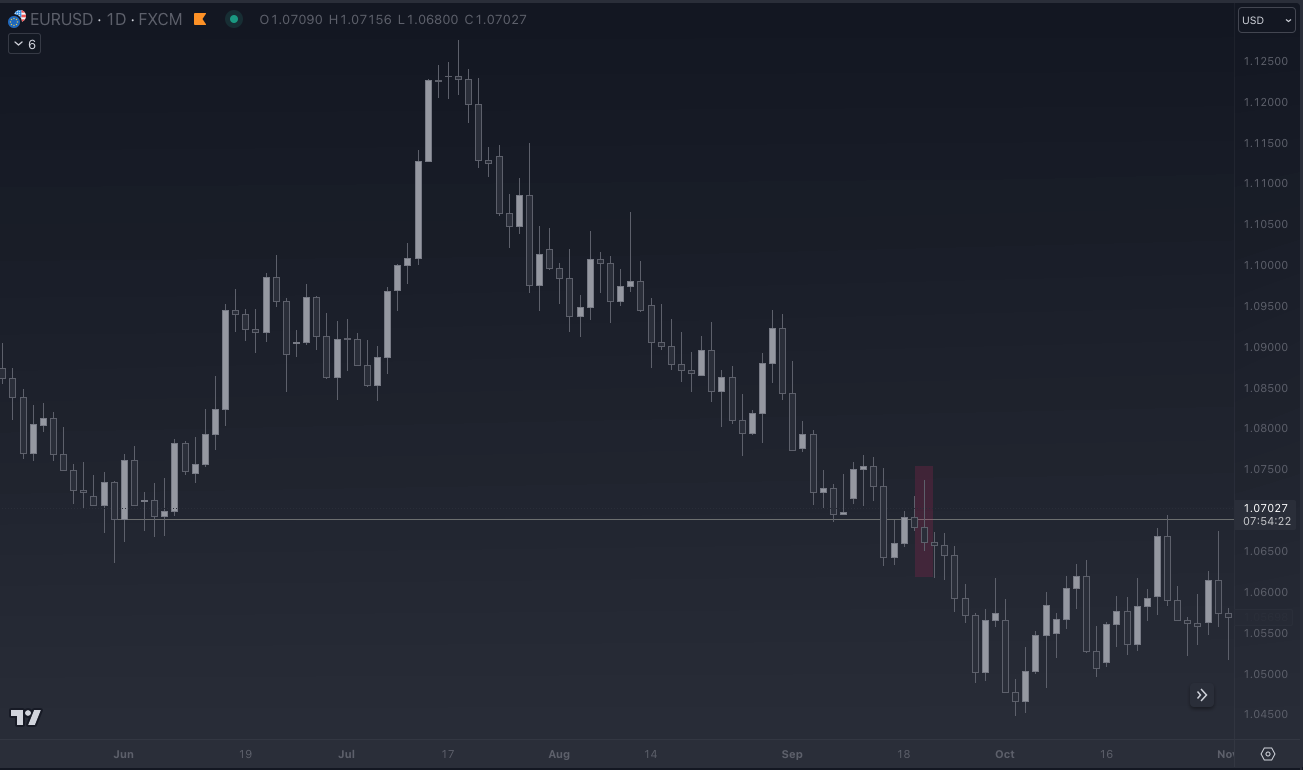
In this example, using the D1 chart, we can spot a shooting star right at previous support (which now is resistance)
The Hammer and Shooting Star, also known as pin bars, feature long upper or lower wicks (tails).
These candlesticks can serve as signals for spotting trapped breakout traders.
Bullish pin bars (hammers) at support levels and bearish pin bars (shooting stars) at resistance levels indicate potential reversals.
Bearish & bullish engulfing price action
The engulfing candlestick is an excellent way to identify exhaustion within a trend.
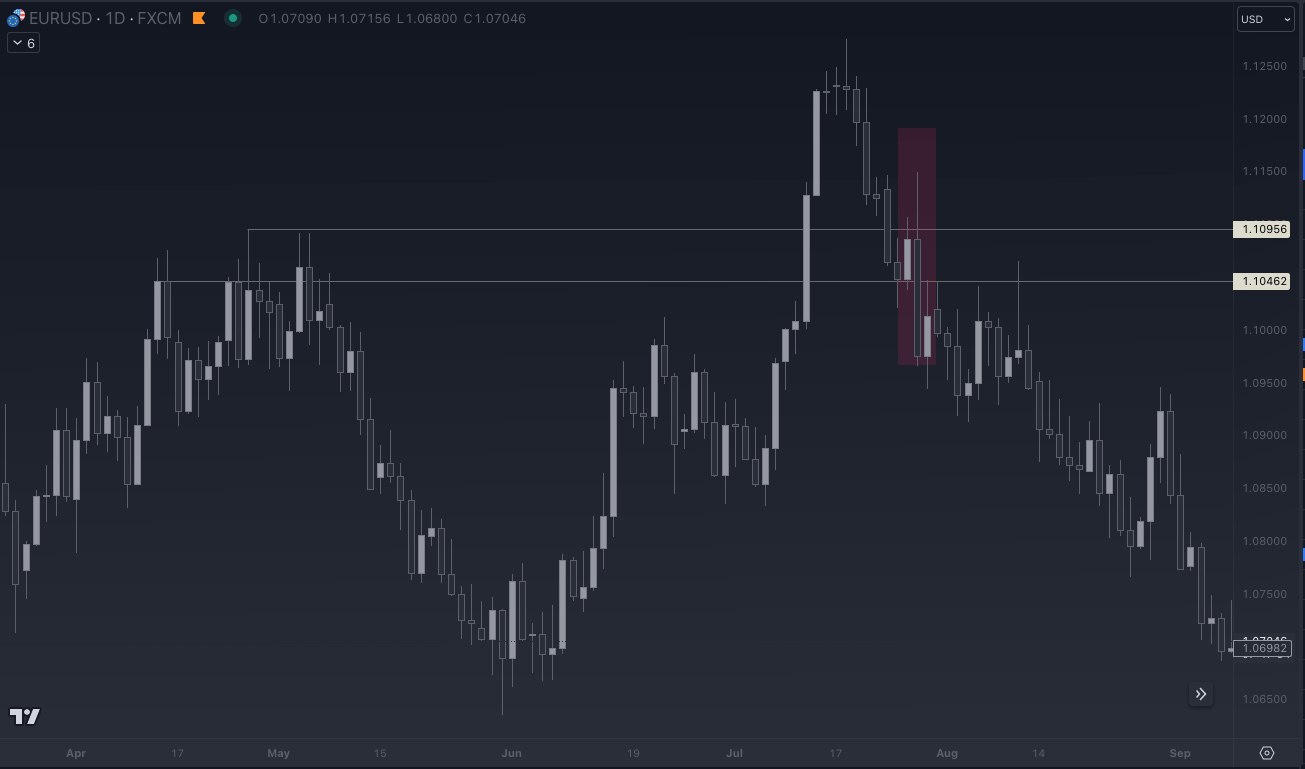
In this example, we can spot a bearish engulfing candle right at previous resistance (which is now support).
The Engulfing candlestick pattern provides an excellent opportunity to identify exhaustion within a trend.
A bearish engulfing candlestick at a previous resistance level (now acting as support) or a bullish engulfing candlestick at a prior support level (now acting as resistance) can offer valuable entry points.
The inside day price action
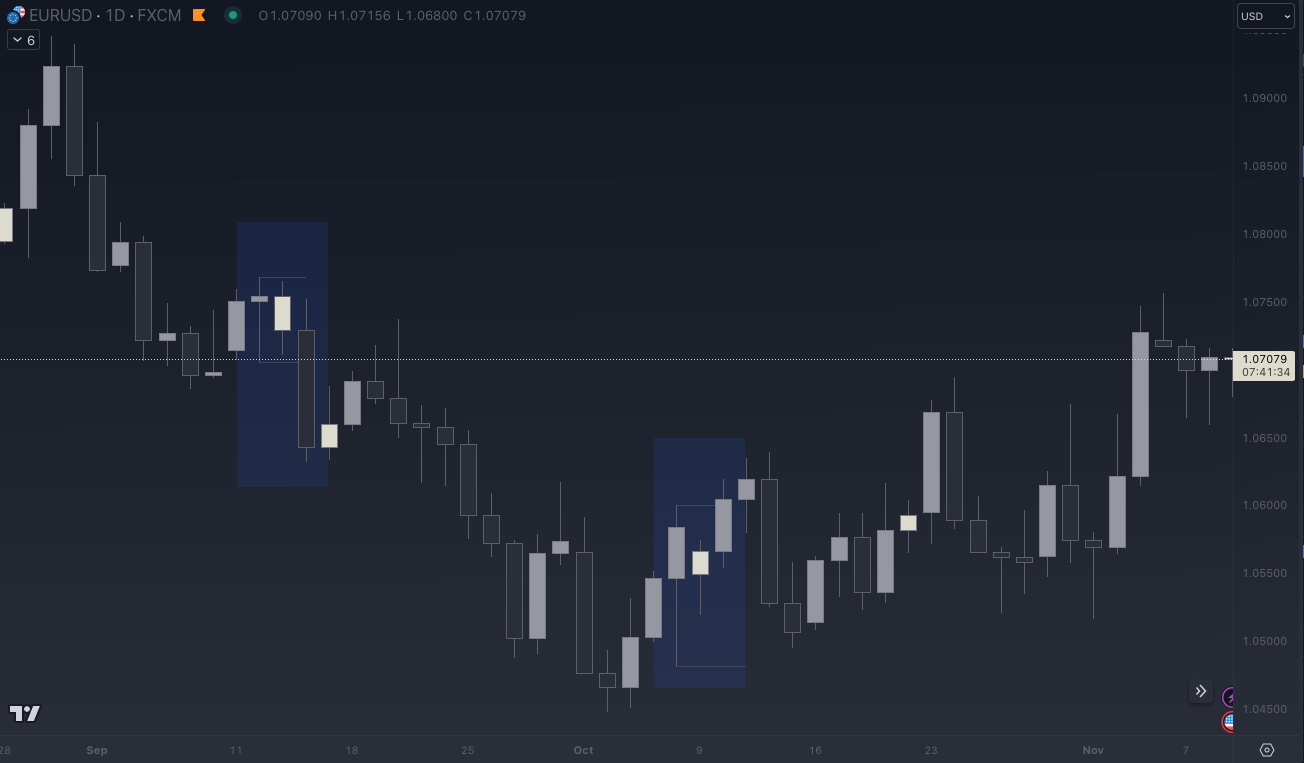
Then we have the Inside Day pattern, this occurs when a smaller candle, known as the inside bar, forms within the range of a preceding larger candle, called the mother bar.
This pattern signifies consolidation following a significant market move, making it particularly useful for breakout traders.
In this example you can spot a bearish and inside bar and a bullish inside bar.
Breakouts occur when the price breaks the high or low of the inside bar, depending on the trend.
The trend is your best friend for trading price action strategies
Using the daily timeframe, traders can identify swing highs and swing lows, which represent turning points in the market.
By analyzing the duration between these points, ranging from weeks to months, traders can determine the overall trend. In an uptrend, the bias is bullish, while in a downtrend, the bias is bearish.
The trend serves as a pivotal factor in making informed price action trading decisions.
Conclusion: Reacting to Price Action on the Charts
Effectively trading price action means reacting to what unfolds on the charts rather than attempting to predict the market’s moves.
Price action strategies have stood the test of time and continue to be embraced due to their simplicity and effectiveness.
While not suitable for all traders, this approach offers a unique perspective, allowing you to observe supply and demand without cluttering your charts with unnecessary indicators.
Just remember that an fx price action signal such as a pin bar or engulfing is only reliable if it forms at a key level.
This is why it’s so important to draw support and resistance levels before scanning for signals.
Patience is crucial in making price action work for you. Focus on quality setups rather than frequency, and always remember to draw support and resistance levels for reliable signals.
With dedication and practice, price action can become a powerful tool in your trading arsenal.